File:4-4-2017 pan plumes vs fog.jpg

Original file (1,986 × 629 pixels, file size: 147 KB, MIME type: image/jpeg)
- Source
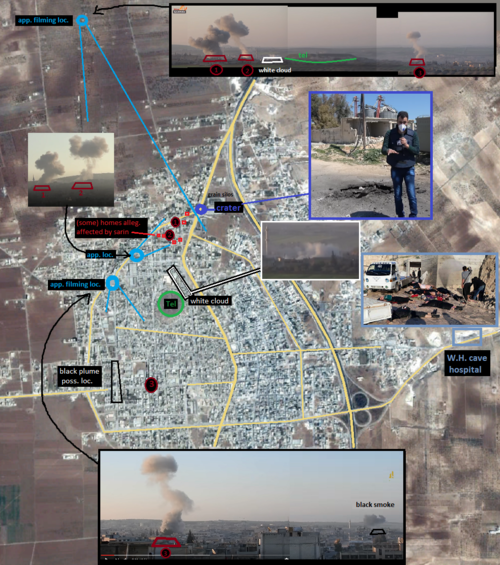
- خان شيخون 4 4 2017 لحظة استهدف مدينة خان شيخون بالقنابل السامة من قبل الطيران السوري - Mohammed Al-Salloum, April 3, 2017
- (Khan Shaikhoun April 4, 2017 moment targeted Khan Shaikhoun city bomb toxic by the Syrian aviation)
- Upload Time (UTC): 04:59:2 - April 4, 2017 (7:59 am local daylight saving time)
- خان شيخون 4 4 2017 انتشار الغازات السامة على ارتفاع منخفض فوق الاحياء السكنية - Mohammed Al-Salloum, April 5, 2017
- (Khan Shaikhoun April 4, 2017 spread of toxic gases low over residential neighborhoods)
- Upload Time (UTC): 16:25:03 - April 5, 2017 (7:25 pm local time)
- Other views
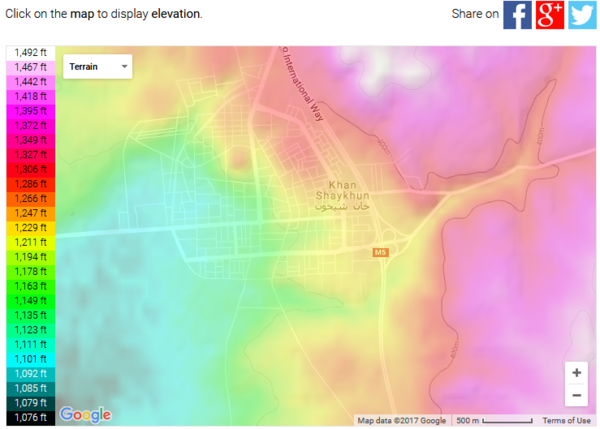
Topographic map
Google +terrain Level lines are easiest to read in the upper left part of the map, from 400 m elevation mark down (other levels unsigned but should go down; higher up would be upwards and right on the map, I think). With this, alleged victims are located lower, like a small alley going down in SSW direction. While winds are opposite. But some of it could slip down if this stuff, whatever it is, is denser than air, and wind is very low (photo, if relevant, suggests that).
I thought the visual map I had was linked here, but it wasn't. This is the correct observation - victims are downhill. The OPCW report decides this is the kill factor, because there was "no discernable wind." But of course that's a bogus conclusion. We can see the wind moving the alleged sarin fog, as it happens, mostly uphill. --Caustic Logic (talk) 11:50, 6 July 2017 (UTC)
densities
air density (at atmospheric pressure) , wiki numbers follow gas law well
t,C rho, kg/m^3
25 1.18391
20 1.2041
15 1.22499
10 1.24663
5 1.26903
Sarin: liquid droplets, 1102 kg/m^3 at 20 C (liquid) by wikipedia; can be (273 +20)/(273 +15)*1102 = 1121 kg/m^3 at 15 C by gas law or a bit higher (comparing 20, 25 degrees densities wiki gives; also compare with water); in any case, about 1000 times heavier. Vaporizes at 160 oC ; in vapor form, heavier than air (molar mass is about 4.9 higher than air). --Resup (talk) 14:25, 8 May 2017 (UTC)
File history
Click on a date/time to view the file as it appeared at that time.
| Date/Time | Thumbnail | Dimensions | User | Comment | |
|---|---|---|---|---|---|
| current | 07:00, 1 May 2017 | 1,986 × 629 (147 KB) | Caustic Logic (talk | contribs) |
You cannot overwrite this file.
File usage
The following page uses this file:


